The administrator dashboard provides the attendance trend, quick view of employees’s attendance/absence record in office, sources of punches, and attendance analytics. There are filters available for all these options through which you can filter out and view the required information.
The administrator dashboard also provides the following information:
- Number of branches
- Active vs Total number of employees
- Active vs. Configured devices
- Unregistered employees

Number of branches
This widget provides the total number of branches in all affiliates configured in SecurTime.
- When you click the View Details link or the up arrow in this widget, you are re-directed to the Branches main page where you can view all the branches configured for all affiliates.

- Click on the Back button/arrow in your browser to go back to the Admin dashboard.
Active vs Total number of employees
This widget provides the number of employees whose employment status are active (still working with your organization) versus the total number of employees added in your organization within SecurTime.
- When you click the View Details link or the up arrow in this widget, you are re-directed to the Branches main page where you can view all the branches configured for all affiliates.

- Click on an employee record to view the details. You can see the employment status as ACTIVE in the Exit Info section of the View Employee page.

Active vs. Configured devices
This widget displays the total number of active biometric devices versus the total number of biometric devices configured in all affiliates of your organization.
- When you click the View Details link or the up arrow in this widget, you are re-directed to the Devices main page where you can view all the configured devices (active as well as inactive) for all affiliates.

Unregistered employees
This widget displays the total number of unregistered employees in your organization.
- When you click the View Details link or the up arrow in this widget, you are re-directed to the Unregistered Employees Report main page where you can select the date range for your report.

Analytics, Trends, Charts, and Graphs
There are a number of analytics that you can view as charts, trends, or graphs. There are filters in each of these analytics so that you can filter information by the relevant affiliate, branch, or additional options and view them as per the input data.
Attendance Trend
The Admin Dashboard provides the present and absent attendance trends for your organization in a bar chart format.
Hover your cursor on the bars to see the number of people present or absent on a particular day.

You can filter this Attendance Trend chart using the the three dots at right corner of the chart, which opens a Filter window, as shown in the following figure. You can filter the information by affiliates, branches, or a date range.

Employees In and Out of Office
This trend data provides the number of employees who are in the office, each employee’s name and ID, and the first and last punch details for the day. The punch details show when each employee has punched in and punched out of the office.

Click on the three vertical dots on the right top corner of the window to open the filter options. A filter window is displayed as shown in the following figure. You can filter the data by different conditional options, affiliates, or branches.

The different filter options for filtering the employee’s punch in/punch out data are shown in the following figure.

For example, if you select Employee Out of Office, and the required affiliate and branch, then the window displays only the employees who have punched out of the office, till that point of time, for the day. The following figure shows the sample filtered data for employees who are out of office for a time period.

Sources Of Punches
You can also view the sources of punches whether it is from a biometric device, mobile, or tablet. Hover cursor over the diagram to see the percentage of punches from each source.

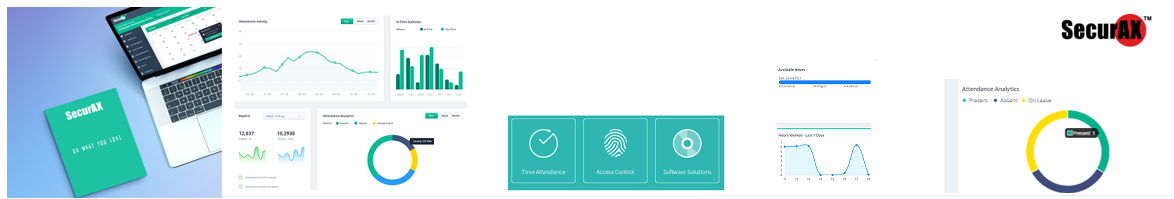
Attendance Analytics
The Attendance Analytics shows the information of number of employees present, absent, or on leave.

You can filter this Attendance Analytics using the the three dots at right corner of the chart, which opens a Filter window, as shown in the following figure. You can filter the anaytics by affiliates or branches.
